


I wanted to cover a new IOS feature that I learned during Cisco Live. VOIP Trace for CUBE is a new feature that can help engineers troubleshoot issues on CUBE deployments. It’s enabled by default, but you will need at least IOS-XE 17.3.2 or higher.
VOIP Trace is used for event logging and debugging of VOIP calls. Using the VOIP Trace framework, the following information is recorded:
- SIP messages for SIP trunk to SIP trunk calls
- Events and API calls from the SIP layer to other layers in CUBE.
- SIP Errors
- Call Control (Unified Communication flows processed by CUBE)
- FSM (Finite State Machine) states and events
- Dial peer matched
- RTP ports allocated
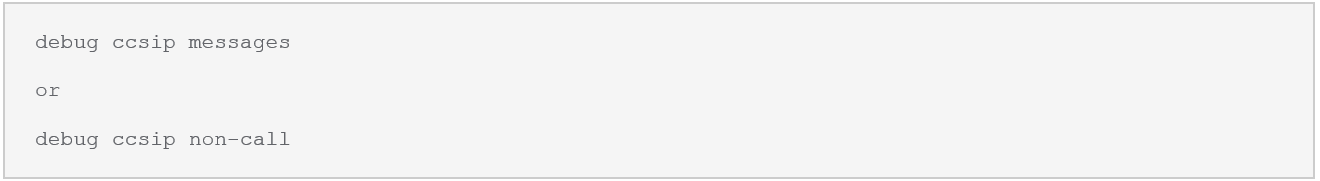
Note: VOIP trace will NOT log REGISTER, OPTIONS, SUBSCRIBE/NOTIFY or INFO messages. You will need to run the following debug command to capture those:
To verify that the VOIP feature enabled check your running configuration for the following configuration:

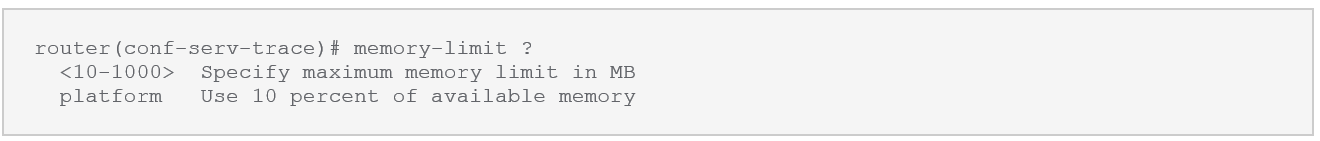
There’s a configurable memory limit allocated for storage of traces in a VoIP Trace framework for CUBE. The configurable maximum memory limit is either available platform memory or 1000 MB, whichever is lower. By default, VoIP Trace will use up to 10% of the total memory available to the IOS processor at the time of configuring the command. For example, if CUBE is used on a platform with 8GB of memory, VoIP Trace will use up to 800MB for trace data. Once the trace memory limit is reached, older traces are overwritten and will no longer be available.
To configure the trace memory limit, use the following CLI command:
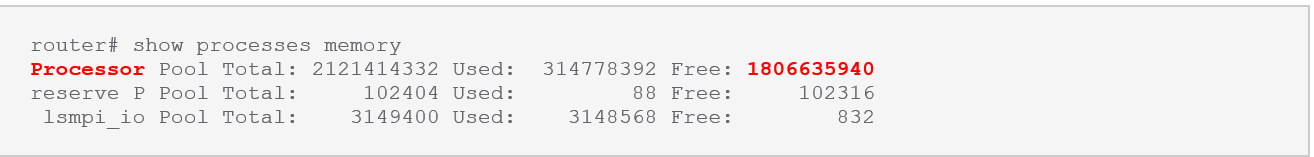
You may also want to check how much memory you have free on your router before increasing the memory limit:
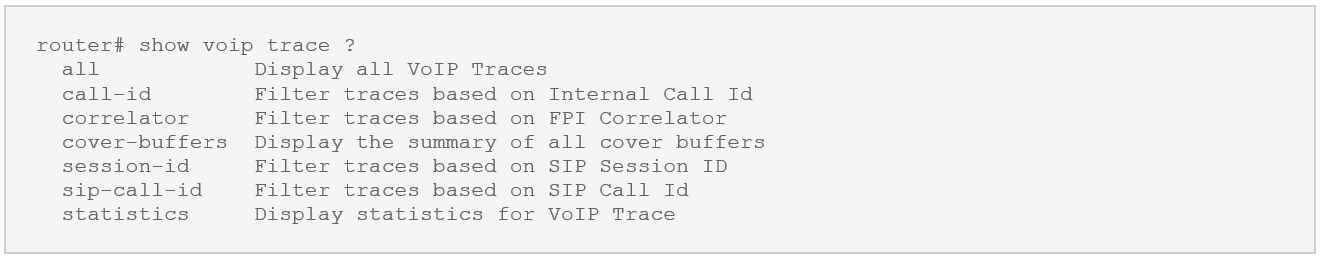
Once the feature is enabled and running you can access the logs via show commands:
Note: Executing ”show voip trace all” will display a huge voip trace that can impact the performance of the router. A warning message seeking confirmation will display before proceeding.
So how can we easily access logs without impacting the performance of the router? We can use cover-buffers (not sure how it got its name!) to search for calls by calling number, called number or call-id.
For example, to find a call we can search for the calling or called number:
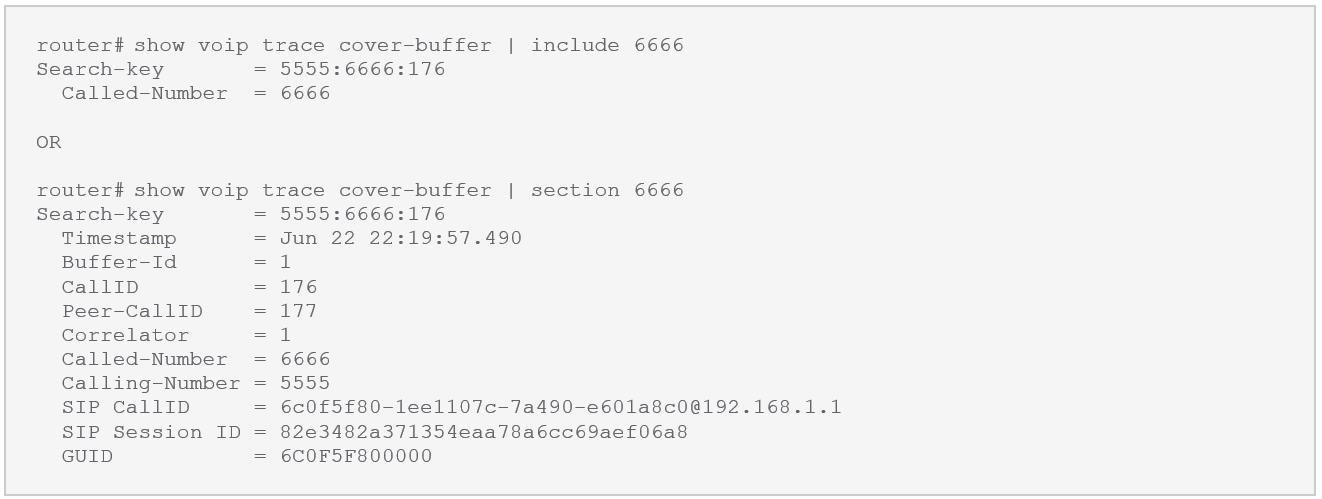
Both commands will return the call-id that can be used to pull up detailed call information. To access the detailed call information, use the following:

To make use of the these features you can create some aliases to make finding and showing calls easier. I use the following:

Show how would I use these? To find a call by calling number or by called number use the following:

Then to show the call details based on the output of the above:

Lastly if you’d like to display the statistics of this command you can view via:

This can show information about the status, memory consumption, errored or failed calls, successful calls, etc
Hopefully this guide can help your business get the correct information to people who need it to troubleshoot an issue. If you’d like to know more or need assistance setting it up, please reach out to our sales team at sales@lookingpoint.com and we’ll be happy to help!

Jeremy Worden, Senior Unified Communications Engineer