


Have you ever found yourself in a position where throughput between devices, either local or across a WAN, seemed lower than expected? You may start by checking the configuration and logs on the network devices along the path, hoping to identify something out of the ordinary or unusual. Often a smoking gun isn’t immediately identifiable which then requires a coordinated approach to troubleshooting and narrowing down the potential causes. This write-up aims to provide some of the practices and tools I’ve used in similar situations.
You’ll also want to have a general idea on what the expected throughput should be. Depending on the traffic path this might involve getting the WAN provider’s advertised bandwidth specifics identified before investigating.
Virtual obstacles can present themselves along the path in many forms. The best way to approach this is to start with the basics.
Use Case Example
This example diagram is referenced below.
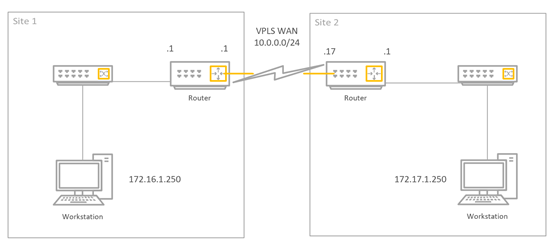
User at Site 1 notified IT that they are experiencing lower than expected transfer speeds between Workstation 1 at Site 1 and Workstation 2 at Site 2. The user who called in distinctly recalls being able to transfer near 50Mbps but now they’re only getting about 20Mbps. The network engineer working the ticket knows the WAN has a 50Mbps bandwidth pipe, so:
- Could this be related to the user’s machine or potentially the machine on the other end?
- Could this be related to local traffic forwarding on the switches?
- Could this be related to the WAN provider’s circuit or network?
STEP 1 - Test Throughput using iPerf application (Workstation to Workstation)
First, reproduce the problem and measure throughput using a handy tool by the name of iPerf. This tool will be the primary tool for measuring throughput between two devices. The only catch is this application cannot be run directly on the switches or routers and requires a PC on either end.
*If interested in performing Cisco to Cisco throughput testing you may be interested in learning about ‘ttcp’, that will not be covered in this blog entry*
What is Iperf? Iperf was originally developed by NLANR/DAST as a modern alternative for measuring TCP and UDP bandwidth performance. Iperf is a tool to measure maximum TCP bandwidth, allowing the tuning of various parameters and UDP characteristics. Iperf reports bandwidth, delay jitter, datagram loss. All very handy details.
On both Workstation machines, download the IPERF from the following URL. http://iperf.fr/
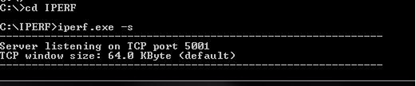
1. On Workstation 2 PC, run the command " iperf.exe –s ". This starts iperf in ‘server’ mode. Effectively waiting for an iperf client to initiate a session.
2. On Workstation 1, run the command “iperf.exe -c <IP Address of the Server>”. This will designate Workstation 1 as the client and will begin the iperf session and will generate traffic and measure throughput and other metrics between the devices.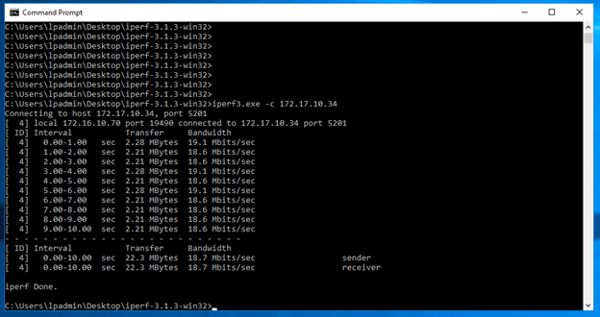
3. To rule out configuration issue on local PCs, run same iperf test from different PC machines. If reduced throughput is still experienced move on to next steps.
STEP 2 - Verify Proper Connectivity and Verify Error Free Interfaces
At this point you’ve confirmed the user report is accurate, based on the iperf result the transfer rate is about 18 to 19 Mbps when it should be closer to 50Mbps.
First, have a clear understanding of the data path, it might help to draw the topology and links. Once you understand the topology, verify Layer 1, Layer 2, and Layer 3 connectivity along the path. You’ll want to verify the following conditions on each network device along the path (Switches and Routers);
- Verify Speed/Duplex settings are as expected (show interface GiX/Y/Z)
- Verify Ports are Error Free (show interface GiX/Y/Z)
- No flapping interfaces or other unusual behavior (show log)
- Unexpected routing path not being taken (Verify with traceroutes and show commands on network devices)
STEP 3 - Check Interface Input / Output Rates Along the Path
Starting from the source, check each switch and router interface statistic for input/output rates. This can be done by issuing the “Show interface GiX/Y/Z” command. If the input rate is close to 50 Mbps at the switch interface where workstation 1 is connected, and close to 50 Mbps on the switch interface where the router connects, as well as 50 Mbps on the router’s interface that connects to the switch, but drops to 20 Mbps at the interface that connects to the WAN it’s a pretty safe assumption that the bottleneck is at the WAN interface.
The input/output rate is averaged over a period of time, the default is 5 Minutes, it’s a good idea to reduce the time period to something shorter to better capture spikes and provide more accurate rates. I like to use 30 seconds as my interval period. This can be done by issuing the “load-interval 30” on the interface configuration.
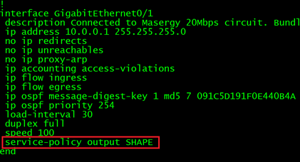
For the purposes of the example, let’s assume the network engineer investigating has already checked and verified the input/output rates on the switch interfaces, and the interface on the router which connects to the switch, all of which show greater than 20Mbps. However, the interface on the router which connects to the WAN provider has the following output rate (20Mbps);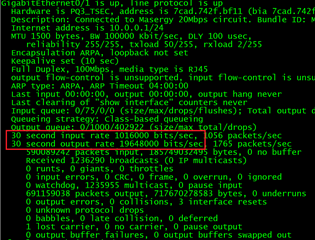
STEP 4 - Configured Policies Which Might Affect Traffic
At this point all indications point to the bottleneck being on the WAN interface. Let’s take a closer look at the WAN interface configuration on the routers. Start with the first router along the path and check WAN interface configuration. You’re looking for service policies which could potentially alter traffic by either policing or shaping the traffic.
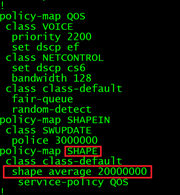
In the example below, an interface configured with a service-policy points to a policy-map named “SHAPE”, further investigation reveals the policy-map is designed to shape outbound traffic to 20Mbps. Could this be it?! A new policy could very well have been implemented and the shaping value either fat fingered or incorrectly listed as 20Mbps when in fact it should have been configured as 50Mbps. Time to update and test!
STEP 5 – Update and Test
Once a potential root cause is identified, schedule a window and update the associated polices (or remove) and test. Run iperf between PC hosts to validate throughput. If you have properly identified the cause, sit back and revel in your accomplishment.
Written By: Michael Lorincz, LookingPoint Network Engineer
If you are interested in LookingPoint managing into your network, feel free to contact us here!