


You read that right! At Cisco Live this year they introduced the ability to add Catalyst switches to the Meraki dashboard. Finally a use for the unused DNA licenses! The switches are monitored in read-only mode, so you still need to manage the switches the old fashioned way, however Meraki's traffic analysis and troubleshooting tools are available for use. This is great for Catalyst owners who do not have DNA Center and want to provide additional visibility into their network.
While today Meraki offers joining Catalyst switches in monitor-only mode, at Cisco Live it was demoed show Catalyst switches being fully managed. The Caveat is that IOS-XE is replaced with Meraki's MS image, effectively turning your 9K switch into a standard Meraki switch. Doing so removes the ability to SSH to the switch and manage the switch locally. I should note however that in monitor-only mode this is not the case. IOS-XE is still the image used for switches in monitor-only mode so SSH and other traditional management protocols are still used to manage and monitor the device.
So what are the requirements for onboarding my Catalyst switch into the Meraki dashboard? This feature is available for the C9200, C9300, and C9500 series models. The switches need to be running IOS-XE 17.3.x or later, and each switch must have an active DNA Essentials or Advantage license. While doing my own testing using a pair of C9200L switches I found out that NPE (No Payload Encryption) images are not supported. When you upgrade the switch make sure to use the Payload Encrypted version.
Onboarding
For obvious reasons the onboarding process is not the same as a Meraki switch. The Catalyst switch needs to be configured to talk to the Meraki Cloud. Luckily Meraki has created a program that will configure the switches for you. This software can be downloaded from the Meraki portal then used to ssh into the switch and link the switch with your organization in the Meraki portal.
So lets go through this process:
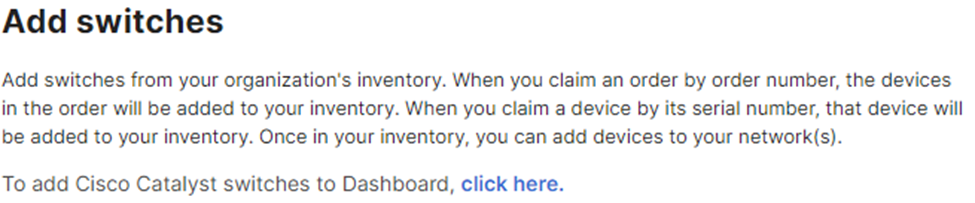
1. Once you have created the network you want to add the switch to, navigate to Network>Add Device then click the "click here" to begin the download of the client software.
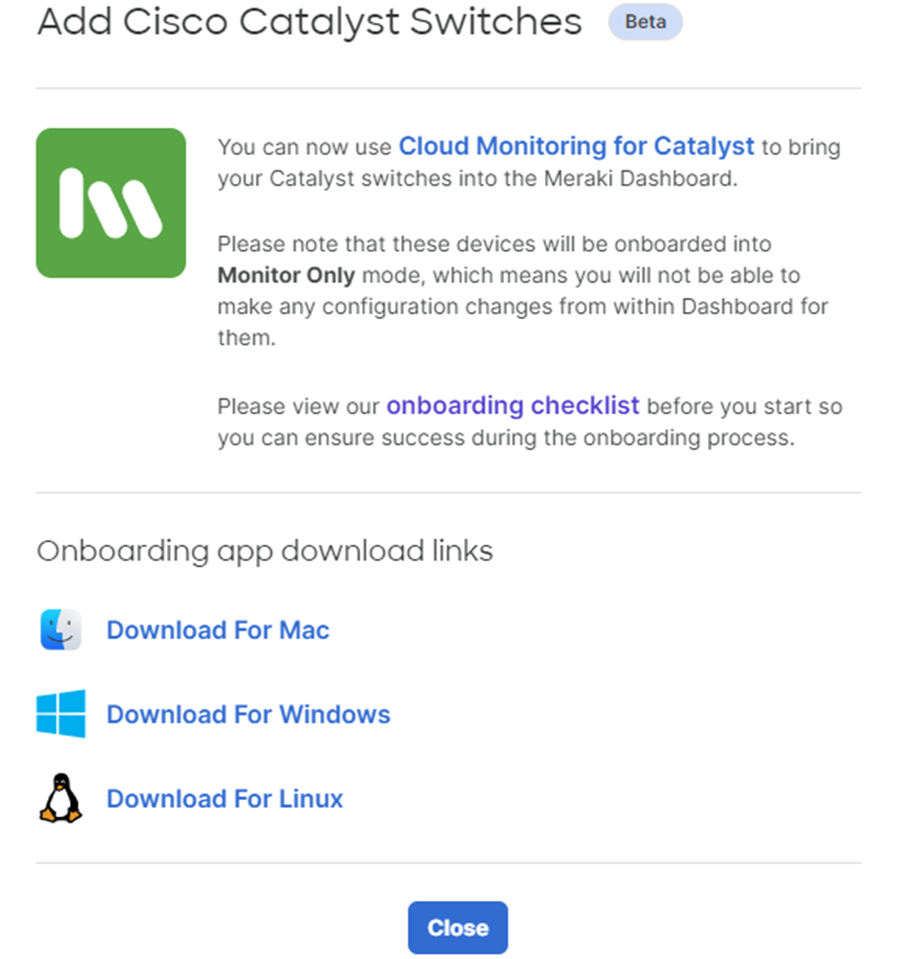
2.Choose the client software for your operating system. Cloud Monitoring for Catalyst software supports Windows, Mac, and Linux.
From here you need to make sure you have an API key assigned to your Meraki account. To add an API key two things need to be configured in the dashboard. First you need to allow API access to the organization, this is under Organization>Settings. Then under your user profile an API key needs to be generated for your user.
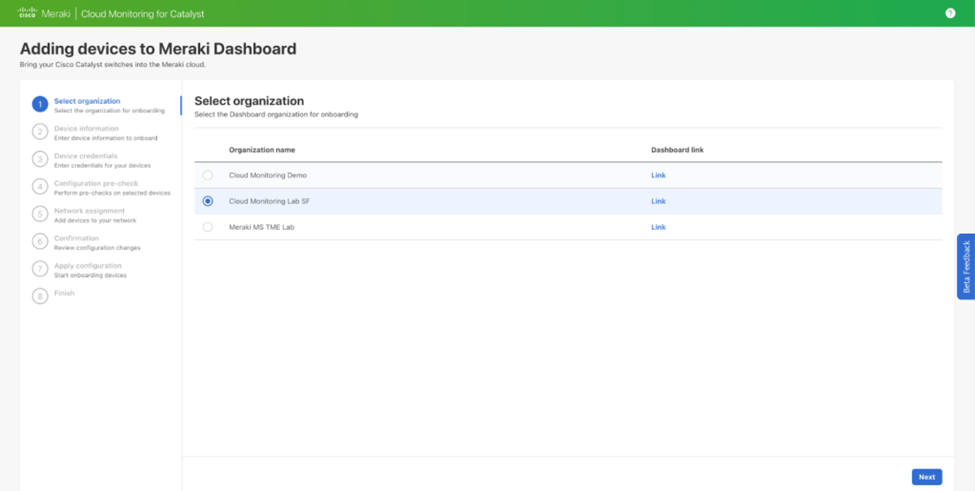
Once the client software is downloaded and installed on your computer you will need to have SSH access to the Catalyst switches that need to be configured. Launching the software brings you to a login page, you will need to login using your API key that was generated earlier. From there the software is a wizard that walks you though the onboarding process. Lets go through the steps:
1. Choose the organization that you want to onboard the switches to. This is important for accounts that use the MSP portal.
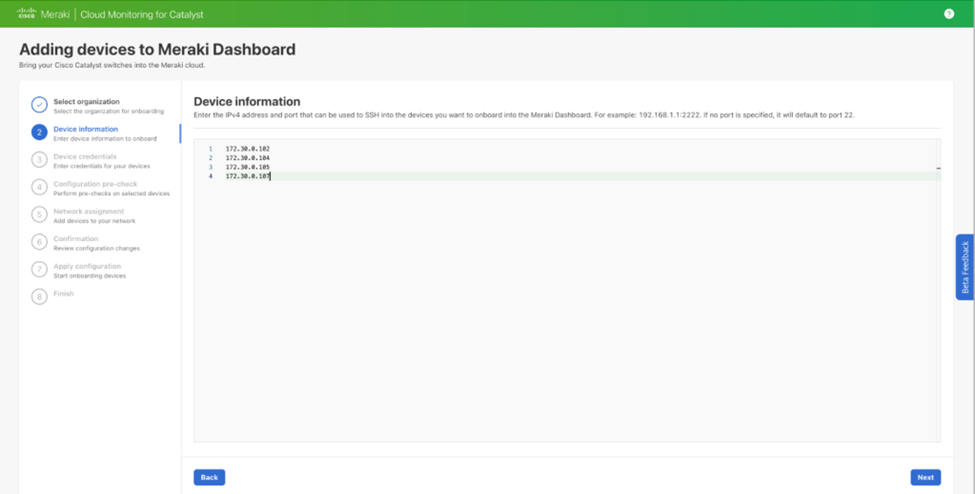
2. Add the management IP address of the Catalyst switches you want to onboard. If you aren't using the standard SSH port on the switch you can add the port to the end of the IP address using the standard x.x.x.x:yy syntax where x is the IP and y is the port number.
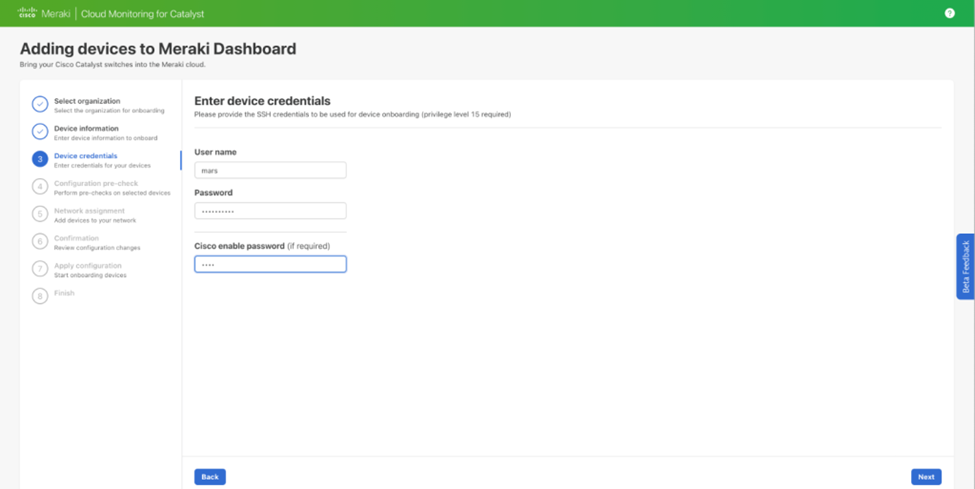
3. Next add the device credentials so that the software can SSH into the Catalyst switches. Note that this is to log into all switches you listed in the previous step, so if you use different credentials then you will need to run this wizard multiple times for each set of credentials.
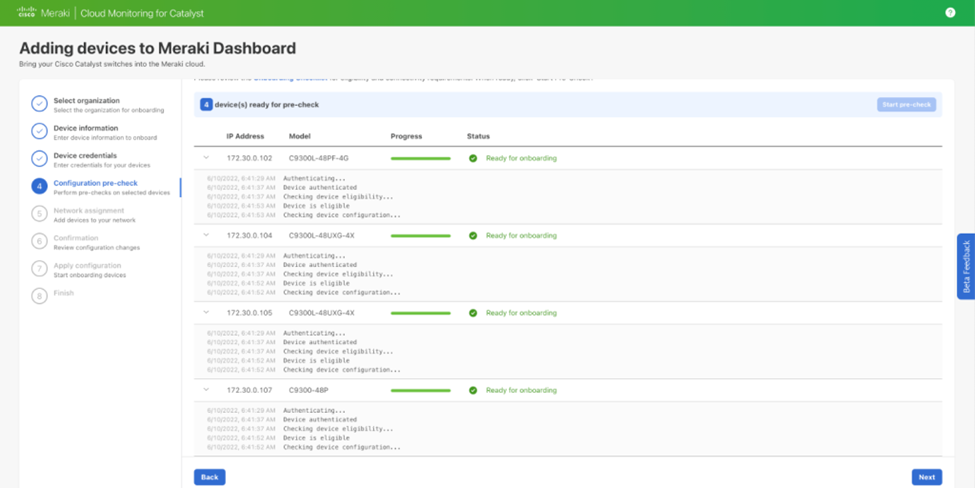
4. From this point the wizard preforms a pre-check that checks for installed licensing and determines if the device is a supported device.
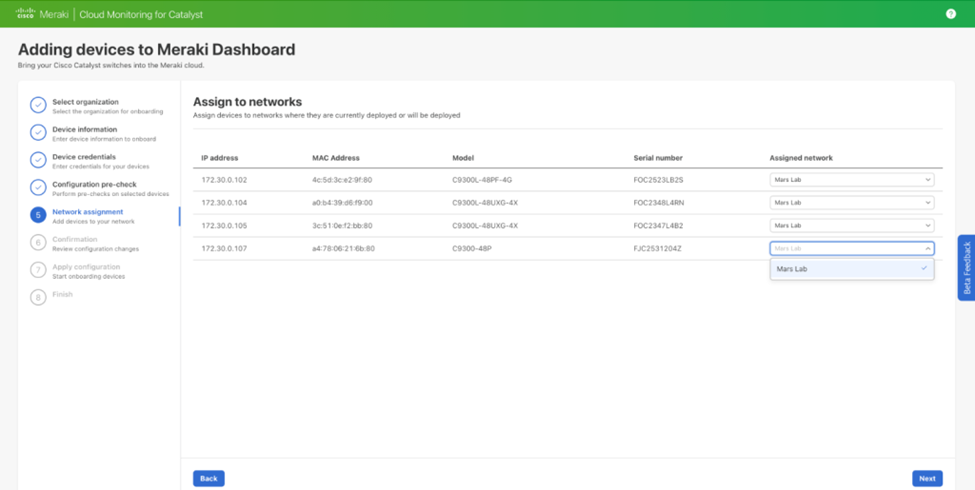
5. After the pre-check then you will need to choose which network to add each switch.
6. From here the wizard will ask you to confirm the changes, then it will start configuring the switches. Once the configurations have been applied the wizard ends with a summary of the changes made on each device.
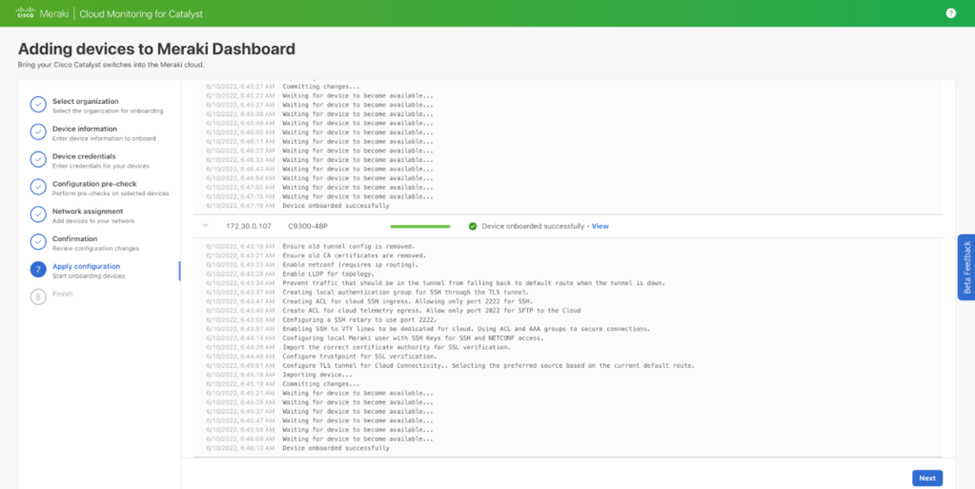
It may take a few minutes for the switches to show up in the dashboard, but once you completed the wizard you will see the switch show up as if it were any other Meraki switch in the dashboard.
Monitoring and Troubleshooting
Once the switch is being monitored in the Meraki dashboard, traffic analytics and port information becomes available. For those who are familiar with Meraki switches will feel right at home with how the data is presented.
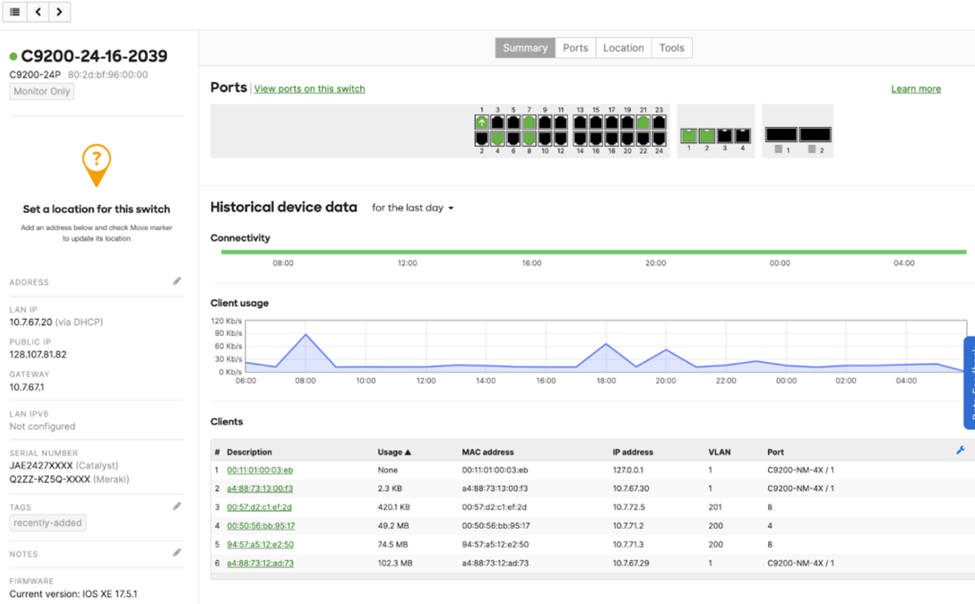
From the summary page we can see port status, connectivity and client details. Note that if the switch only has the DNA-Essentials license then the client-level traffic analysis data will not be displayed. To enable these features you will need to upgrade the license to use DNA-Advantage licensing. On the left side of the screen things like management IP, serial numbers and IOS version are displayed.
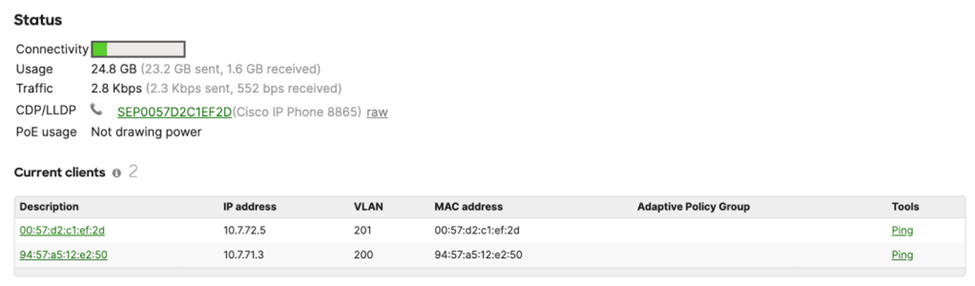
Just like the Meraki switches in the Port view things like connected client MACs and CDP/LLDP information is displayed.
Troubleshooting
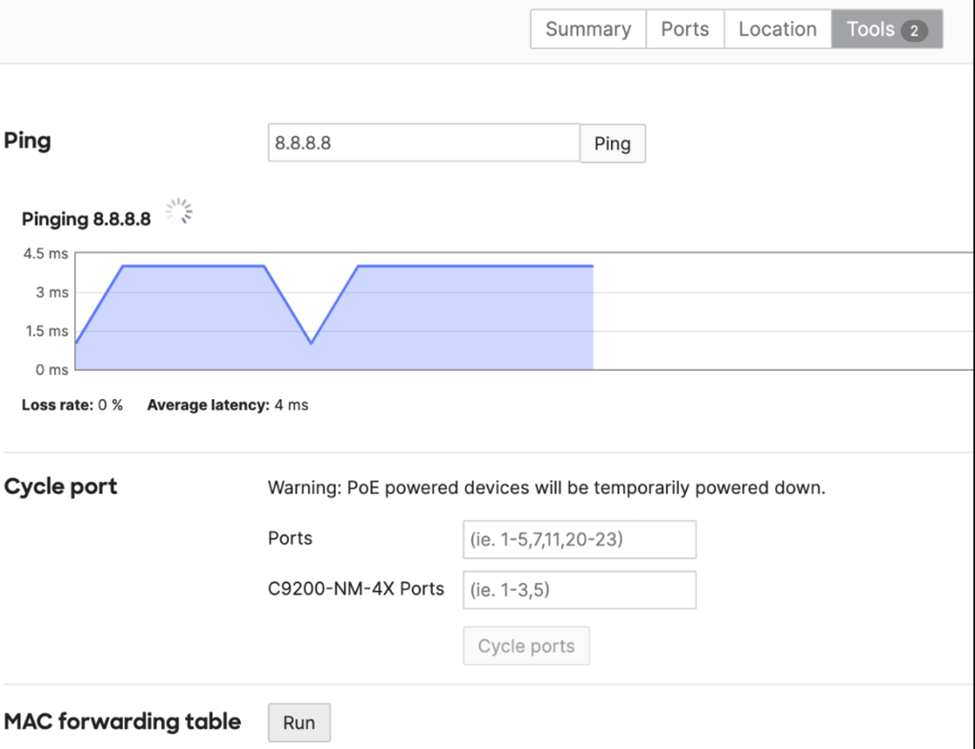
While you cannot manage a Catalyst switch via the dashboard, there are a few tools that you can use to troubleshoot issues. Under the tools view you will be able to ping from the switch, cycle ports, which is good for power cycling PoE devices, and to check the MAC address table.
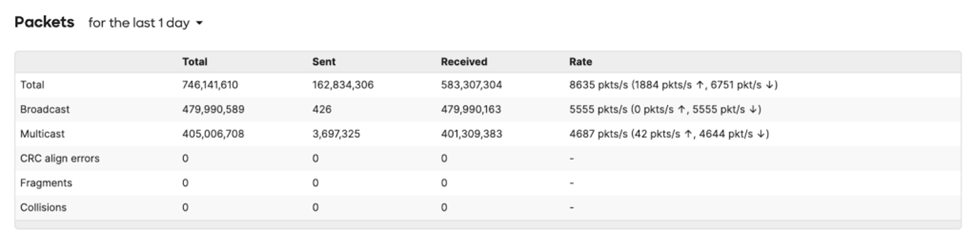
In addition to the standard troubleshooting tools, packet counters are also available to help with any asymmetric issues.
We are starting to see Meraki's full integration with Cisco, and Catalyst Monitoring is just the beginning. I am sure we will see more detailed information and analytics come as this feature is updated in the future. And we finally we have a use for those DNA licenses that have been gathering dust for the last few years.
If you or your company are interested in learning more, please reach out to us at LookingPoint at sales@lookingpoint.com, we can help!

Trevor Butler, Network Architect